
DATA ANALYSIS

What You'll Get
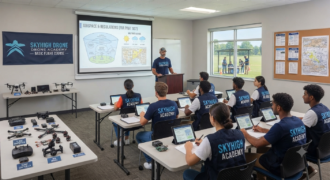
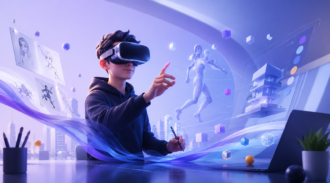
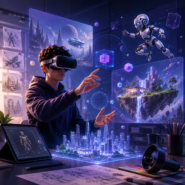
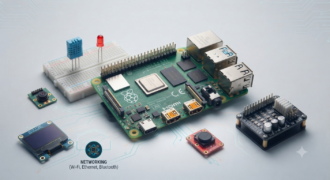
Don't just code for screens—build for dimensions. Our physical campus features state-of-the-art VR labs equipped with the latest headsets and spatial tracking systems, allowing you to test, optimize, and perfect your
immersive apps in real-time.
Download Broucher

Other Courses
Suresh
"VRx NextGen is a great place to learn Virtual Reality and emerging technologies. The trainers are supportive and the practical sessions helped me understand concepts easily."
Rohan
"A great institute for learning future technologies. The instructors are experienced, and the practical sessions make learning enjoyable and effective."